During the development of another R package I wasted a bit of time figuring out how to add code coverage to my package. I had the same problem last time so I decided to write up the procedure step-by-step.
Provided that you’ve already written an R package, the next step is to create tests. Luckily, devtools package makes setting up both testing and code coverage a breeze.
Let’s start with adding an infrastructure for tests with devtools:
library(devtools)

use_testthat()
Then add a test file of your_function() to your tests folder:
use_test("your_function")
Then add the scaffolding for the code coverage (codecov)
use_coverage(pkg = ".", type = c("codecov"))
After running this code you will get a code that can be added to your README file to display a codecov badge. In my case it’s the following:
[](https://codecov.io/github/erzk/PostcodesioR?branch=master)
This will create a codecov.yml file that needs to be edited by adding:
comment: false

language: R

sudo: false

cache: packages

after_success:

- Rscript -e 'covr::codecov()'
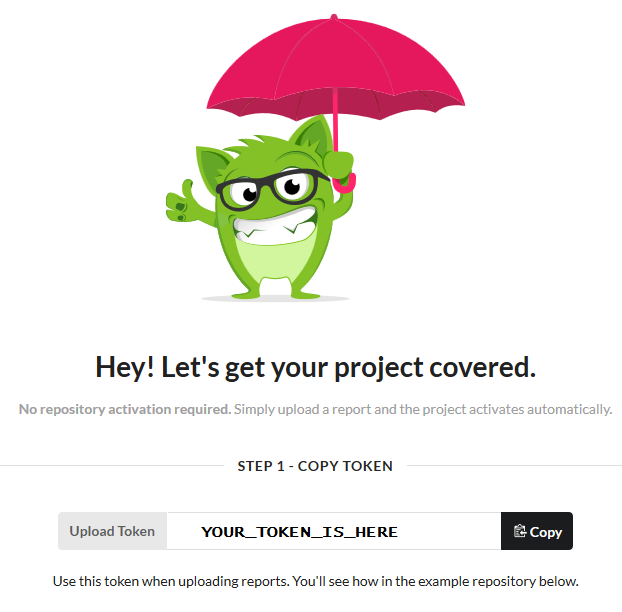
Now log in to codecov.io using the GitHub account. Give codecov access to the project where you want to cover the code. This should create a screen where you can see a token which needs to be copied:

Once this is completed, go back to R and run the following commands to use covr:
install.packages("covr")

library(covr)

codecov(token = "YOUR_TOKEN_GOES_HERE")
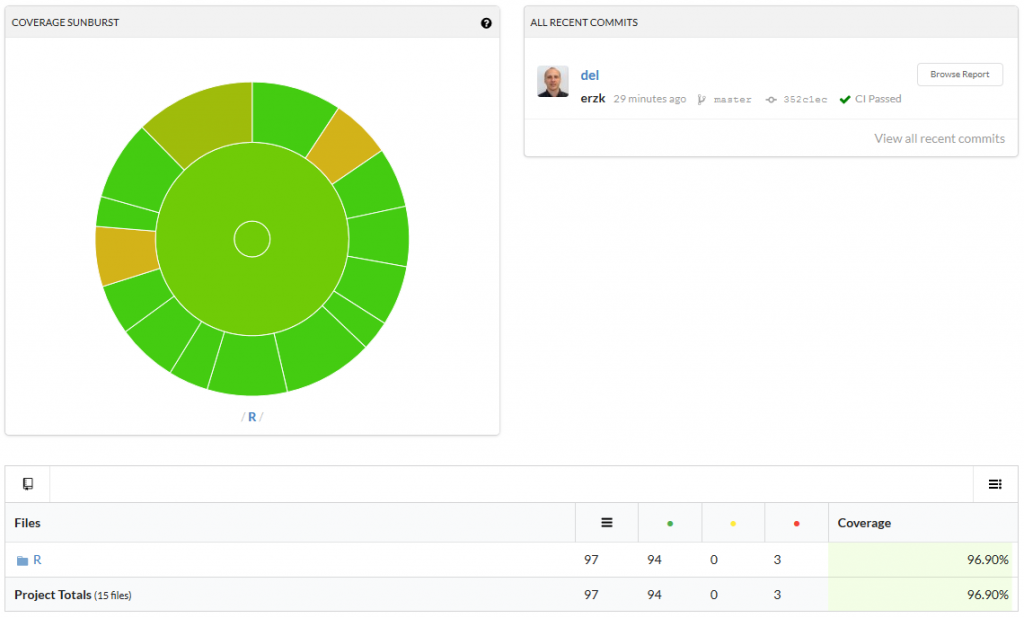
The last line will connect your package to codecov. If the whole process worked, you should be able to see a percentage of coverage in your badge, like this:
![]()
Click on it to see which functions are not fully covered/need more test:

I hope this will be useful and will save a lot of frustrations.