Configuring Tableau Web Data Connectors on Windows 10 - using Google Sheets

Tableau Desktop 9.1 is out and Web Data Connectors are available as a new data source in this version. Luckily Tableau released several working connectors to popular web data sources and Google Sheets is one of them. Today I tried to connect to Google Sheets but I couldn’t find a step-by-step description of setting it up and the official thread lacked details about configuring WDC. It took me a while to figure out how to start using Web Data Connectors so I decided to write this tutorial which hopefully will help others to start using Web Connectors. This tutorial describes how to use Tableau web connectors hosted locally.

Before starting to use Web Data Connectors you need to activate Internet Information Services (IIS) Manager (more info available in this Stackoverflow thread).
This can be done on Windows 10 by pressing Windows key and typing Windows Features.
Then go to Turn Windows Features On or Off, and tick the box next to Internet Information Services.

Now you should be able to see IIS in Control Panel > Administrative Tools.
ISS_port_80
Open IIS Manager to check the values in Binding and Path columns. Binding should be set to *:8888 (http). Path points to a folder where the Tableau Connector files should be stored.
If Binding is set to a different value than 8888 (mine was set to 80 by default) then go to Actions on click on Bindings.

Then change the Port number to 8888 and click OK.
edit_site_bindings
Now your IIS Manager configuration should look like this
ISS_configuration
Check the value of the Path column. It’s set to %SystemDrive%\inetpub\wwwroot by default which in most cases means C:\inetpub\wwwroot

In order to start using Google Sheets as a data source you need to start with downloading the Web Data Connector SDK.
Unzip the zip file and go to the Examples folder.
Copy all files from the Examples folder to the Path specified in IIS. In my case it was C:\inetpub\wwwroot

Now you should be ready to start using Web Data Connectors. Go to Connect > To a server > Web Data Connector
A pop-up window like the one below should appear
tableau-web-data-connector

If you copied the example files provided by Tableau to your IIS path then type the following into the address bar of the WDC pop-up window:
http://localhost:8888/GoogleSheetsConnector.html
You should see the following window
googlesheet_connector
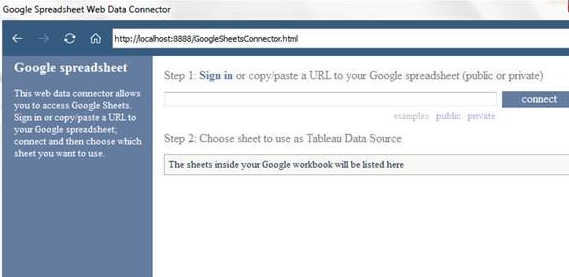
All you need to do now is to provide a link to a Google Sheet you want to use. You might also need to log into your Google Account if a Sheet provided is private.
Now you can start using Google Sheets as a data source. Hooray!

If you need to use other connectors then just change the path in the Address bar of the pop-up window.

Analysing Quandl FX data in R - plotting, decomposing time series, and detecting anomalies

Quandl is a great provider of various types of data that can be easily integrated with R. I wanted to play with the available data and see what kind of insights can be gathered using R.

I wrote a short script that collects British Pound Sterling (GBP) to Polish Złoty (PLN) historic exchange rates from 1996 till today (4th September 2015).

First thing I did was loading the libraries that will be used:

Then I downloaded the exchange rates data from Quandl. Data can be downloaded in several popular formats (i.e. ts, xts, or zoo), each appropriate for different packages.

Once I collected my data, I started cleaning the data frame that was downloaded from Quandl.
The column names designating High and Low Rates had whitespaces in them, and that could cause all sorts of problems in R. I removed ‘High_est’ and ‘Low_est’ from the xts data to make plotting with dygraphs easier. Thanks for lubridate package I easily extracted years, months, and days from the Date field. I also added a ‘Volatility’ column that showed the difference between the High and Low rates.

Now I had all my data cleaned so I could start plotting. I started by shamelessly copying the code for the Reuters-like plot that was included in Quandl’s cheat sheet.

GBP/PLN Historic Exchange Rates

All plots were created using the following code:

The results can be seen underneath.

Density plots:
gbp.pln.fx.rate.density.by.year

Histograms:
gbp.pln.fx.rate.histogram.by.year

gbp.pln.fx.rate.histogram.by.month

Volatility histogram shows clearly that there are many fields with missing values.

GBP/PLN Volatility

Comparing the blank fields with those containing non-zero values showed that the number of blank vs. non-blank is almost the same. This means that Volatility should not be used as it has a high number of missing values.

The box plots show how the GBP/PLN exchange rates fluctuate across different years and months. They also include the mean values and the variation in the exchange rates.

Last, but not least was the interactive plot created with dygraph package. That’s definitely my favourite as it allows fine-grained analysis of the underlying information (including date range selection).


I added the event lines that seemed to be relevant to the the observed maximum and minimum values of the GBP/PLN exchange rates. Around the time when Poland joined the EU, the GBP/PLN exchange rate peaked at 7.3 PLN. Four years later, just before Lehman Brothers went bankrupt, Pound Sterling was valued as low as 4.07 PLN.

The interactive plot was created using the following code:

I thought that I had enough simple plots and now was the right time for more complicated analyses. I started with the Seasonal Decomposition of Time Series by Loess using the stl function.

GBP/PLN Seasonal Decomposition of the Historic Exchange Rates

Seasonal, trend and irregular components were extracted from the underlying data. The main trend is showing the appreciation of GBP against PLN but the seasonal component might be (?) indicating approaching correction of that trend.

I wanted to finish the analysis with applying the Anomaly Detection package, that was released by Twitter’s engineering team, to my data collected from Quandl. My plan was to see whether there were any anomalous changes of the exchange rate during the recorded period.

Running this code resulted in obtaining one anomalous value, i.e. 7.328 PLN, which was the maximum value observed in the collected time series.

I hope that you enjoyed this walkthrough. In future posts I want to descibe more ways to analyse time series.