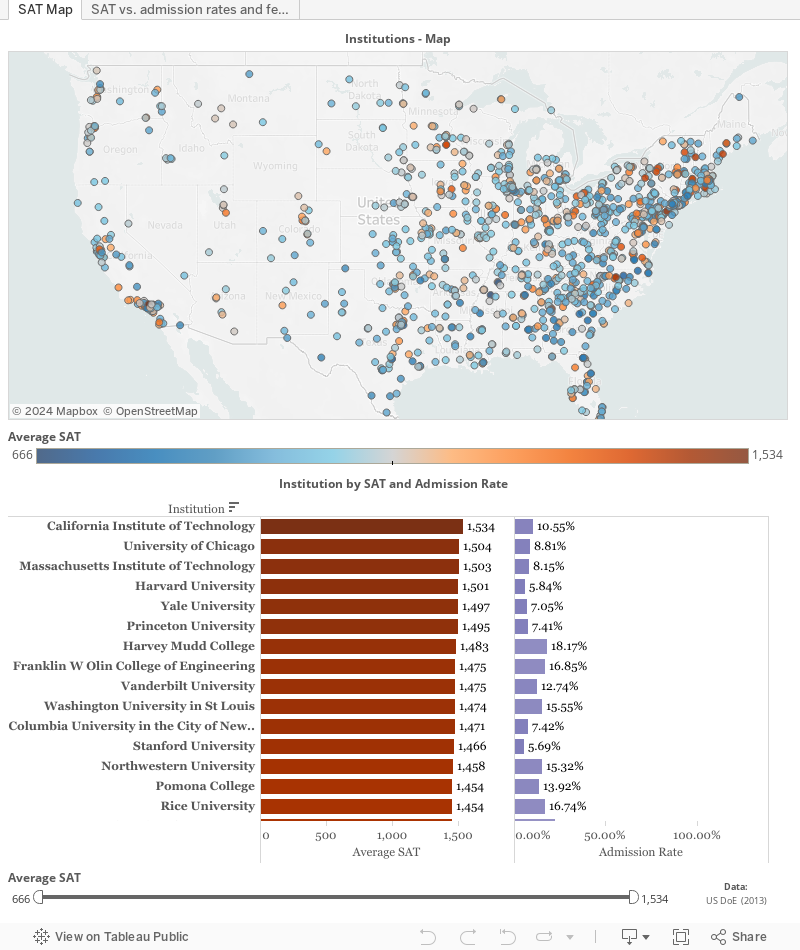
I finally found some time to crunch numbers from a Kaggle swag competition. Available dataset was rather large, but I wanted to focus on the latest data (from 2013) so I only analysed MERGED2013_PP.csv. I started filtering numbers in R but then I decided to move back to Tableau for interactive visualizations. The result can be seen underneath and I hope it’s self-explanatory.
I’m back to analysing political data after finding nicely formatted data set on one of my favourite blogs. The blog post that inspired me to do it discussed the possibility of predicting election results using polls and popularity data found online. In brief, he response is: not yet. However, with the increasing number of people using digital media and opinion polls, these channel will have more impact on the future political campaigns.
I haven’t used the actual results in this analysis but I only used the variables that came with the compiled data set. The variables in questions are: Google Trends popularity, Social Media popularity, and Opinion Polls. More details about the data can be found here (text in Polish).
After loading the data, I used the missmap function to examine the missing values. It seems like there are quite a few gaps in the data about the polls, social media, and Google Trends (in the decreasing order).
To get an overview I used tableplot from the tabplot package.
The next step was plotting time series of the individual variables.
The plots above show that the overall Social Media and Google Trends activity (dark blue line) increased closer to the election day. The averaged rating (dark blue line) of all parties in the polls seemed fairly stable. This is probably not the most interesting finding so splitting the values by party/candidate would be recommended.
Autocorrelation was conducted on the cleaned data frame (NAs were removed) to show how the variables correlate with themselves.