Extracting pitch track from audio files into a data frame

My task was to extract pitch values from a long list of audio files. Previously I used Praat and R for this task but looping in R was rather slow so I wanted to find another solution. The following analysis was developed on Linux (Ubuntu).

Firstly, aubio (CLI-only Python tool) was used to extract pitch from wav files. aubio has fewer arguments than Praat and it returned awkward values using default settings so I didn’t explore it further. The good thing about it is that it is easy to use and is relatively simple and Python-native. To extract pitch with aubio use:

sudo apt install aubio-tools
aubiopitch -i P17_trim_short_10.000-11.150.wav

Eventually I decided to stick to Praat, which is the workhorse of phonetics and can be used from the command line.

Praat saves all commands that are executed and this can be a great start for creating a script. More information about scripting in Praat is here. My solution is here:

This script will extract .pitch files from all .wav files in the working directory and will save them to a subfolder. Praat scripts can be called from the command line:

praat --run extract_pitch_script.praat

Which will extract pitch tracks from all .wav files in the directory. The pitch extraction will use default settings in Praat. The output will be one .pitch file for each .wav file. The files themselves contain all candidates and are not in a tidy format so they have to be transformed. This step could probably be done in Praat scripting but I did not have patience to achieve it there and I moved to R which could easily produce desired output.

R can be called from the command line using littler. Shebang on the first line means that the script can be called from the command line. The script below transforms .praat files into clean .csv files.

To invoke the R script, run in the command line:

r praat_pitch_analysis_CLI.R untitled_script.pitch

This creates a .csv file with the best candidate pitch above a certain confidence threshold. Pitch extraction algorithm used by Praat was developed by Boersma (1993).

Automatic splitting of audio files on silence in Python

In my previous post I described how to split audio files into chunks using R. This time I wanted to use Python to prepare long audio files (.mp3) for further analysis. The use case would be splitting a long audio file that contains many words/utterances/syllables that need to be then analysed separately, e.g. recorded list of words.

The analysis described here was conducted on Linux (Ubuntu 16.04) and it should be fairly similar on MacOS, but Windows would require quite a few ammendments.

The first step was to turn the original .m4a files into .mp3 and to extract the segment I was interested in. I used ffmpeg for these tasks. This can be skipped if your files are already clean.

ffmpeg -i P17.m4a P17.mp3
ffmpeg -i P17.mp3 -ss 00:17:50 -to 00:23:30 -c copy P17_trim.mp3

The second command created a copy of the original .mp3 file and extracted the segment between 17 min 50 sec and 23 min 30 sec. That’s where speech was recorded in my file.

ffmpeg output

The continuous audio file that I used contained repeated utterances of the same syllable. Use the code below to split this file into segments. Silence detection is conducted using Support-vector machine (SVM):

Install pyAudioAnalysis and run on the command line:

python pyAudioAnalysis/pyAudioAnalysis/audioAnalysis.py silenceRemoval -i P17_trim_short.mp3 --smoothing 1.0 --weight 0.3
pyAudioAnalysis detect silence in audio files
Top row shows the waveform of the audio signal. Y-axis is amplitude, X-axis is time. Bottom row shows the probabily of non-silence, the vertical lines are markers that will be used to split the file.

The result is a list of sliced wav files. The names contain timings of the boundaries.

pyAudioAnalysis silenceRemoval output example.

All files in a given directory can be split using the following script:

Make sure to point the script to the directory where audioAnalysis.py lives. Modifying smoothing and weight parameters will lead to different effects so this should be adjusted depending on a type of audio recording. By default the script will show a pop-up window with the suggested split. This is very useful for monitoring data quality. The Python script can be used from the command line with:

python split_continuous_audio.py

Enabling MATLAB in Jupyter notebooks on Linux

Introduction

In my previous post I showed how to enable MATLAB in Jupyter notebooks on Windows. Now it’s time for GNU/Linux (Ubuntu).

My main issue with enabling new kernel was having initially installed two Anacondas and two Python versions (2.7 and 3.5). After a lot of frustration, I decided to remove both Anacondas and have a clear install of the latest Anaconda with Python 2.7 and 3.5. In this tutorial I assume that Jupyter and MATLAB are already installed on your system.

Using the right environment

Although the official MATLAB website states that Python-MATLAB engine works with Python 2.7, 3.4, 3.5 and 3.6, I struggled to install it using Python 3.5. If you try to install it with a 3.5 version, you will see the following error:

OSError: MATLAB Engine for Python supports Python version 2.7, 3.3 and 3.4, but your version of Python is 3.5

The error makes it obvious that you need an older version of Python. I decided to use 2.7. To do that, I created another environment with Python 2.7:

conda create -n py27 python=2.7 anaconda

The guidelines to managing Python environments are here.

The next step was checking what environments were available:

conda info --envs

And activating Python 2.7 (py27):

source activate py27

Install Python-MATLAB engine

To install the engine connecting both languages: go to your MATLAB folder, find the Python engine folder and install setup.py. This can be done in the following way:

Change your working directory to where your MATLAB lives:
cd "MATLABROOT/extern/engines/python"

If you don’t know where your MATLAB is installed, use:
locate matlab

Then install the engine (it will only work with MATLAB >=2014b):

sudo python setup.py install

And the latest remaining dependencies:

sudo pip install -U metakernel
sudo pip install -U matlab_kernel
sudo pip install -U pymatbridge

That should do the job. Now open new Jupyter notebook:

jupyter notebook

To check whether you can find MATLAB among the available engines (top right corner):

Now check whether you can actually run the notebook. Initially, when I tried using Python 3.5, I could see MATLAB among the options but the kernels would die each time I tried running the MATLAB code. Moving to Python 2.7, as described in this tutorial, solved the problem.

If all works fine then the following notebook should generate correctly:

Even though I’m getting the MetaKernelApp error, the notebook continues to work correctly:
[MetaKernelApp] ERROR | No such comm target registered: jupyter.widget.version

To leave the environment used to run the notebook, simply type:

source deactivate

Notes

Initially, I struggled a bit with making it all work so in the meantime I also tried installing Octave (a free equivalent of MATLAB). I’m not sure whether that installation helped me with running MATLAB within Jupyter.

While trying to install the engine I came across several errors. I guess that most of them were related to my OS configuration and all of them were solved by searching for the error message. One of the errors was:

Error:
[I 00:58:19.847 NotebookApp] KernelRestarter: restarting kernel (3/5)
/home/eub/anaconda3/bin/python: No module named matlab_kernel

This was due to installing the Python engine in the wrong environment (i.e. my default Python 3.5). It was solved by activating Python 2.7 and using it to install the Python-MATLAB engine.

I think that there is an alternative way to activate MATLAB in Jupyter, without Anaconda, would be to explicitly point the installer to the Python version that supports the Py-MATLAB engine.

In my case:
sudo ~/anaconda/pkgs/python-2.7.13-0/bin/python2.7 setup.py install

You might also want install the engine in a non-default location. In that case, MATLAB has a solution to that problem and suggested installing Python in the home directory.

There is another Jupyter kernel (imatlab) engine that supposedly works with Python 3.5 and MATLAB R2016b+ but I haven’t tested it myself. As long as my current configuration works, I’m not planning to go through the hell of installing dependencies again.

Sending serial triggers from PsychoPy to ETG-4000 fNIRS

In the process of designing my latest experiment in PsychoPy I realised that setting up the serial port connection is not the most obvious thing to do. I wrote this tutorial so that others (and future me) won’t have to waste time reinventing the wheel.

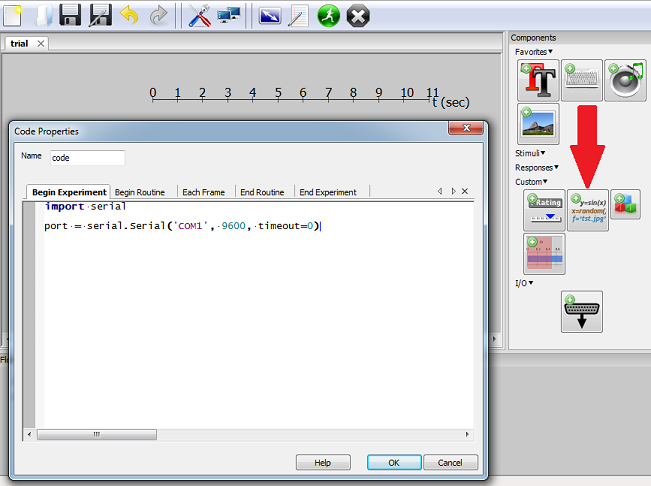
After creating an initial version of my experiment (looping over a wav file) I tried to figure out how to send a relevant trigger to my fNIRS. Luckily, the PsychoPy tutorial has a section about using a serial port, but after reading this I still wasn’t sure how to use the code with my script. After a quick brainstorm with the lab technician, we figured out that a simple script (see below) is indeed sending triggers to the fNIRS:

To better understand the arguments of the serial.Serial class please consult the pySerial documentation.
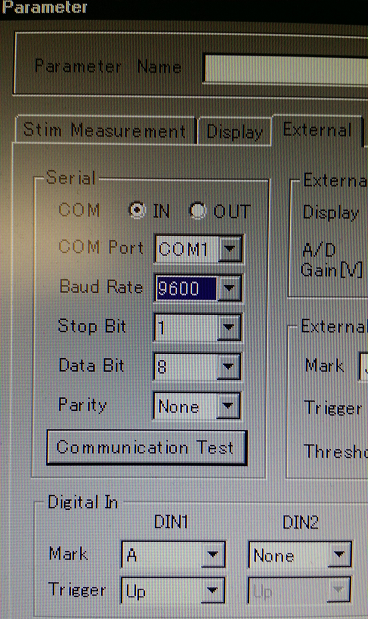
The argument (‘COM1’) is the name of the serial port used. The second argument is the Baud rate, it should be the same as the Baud rate used in the Parameter/External settings of the ETG-4000:

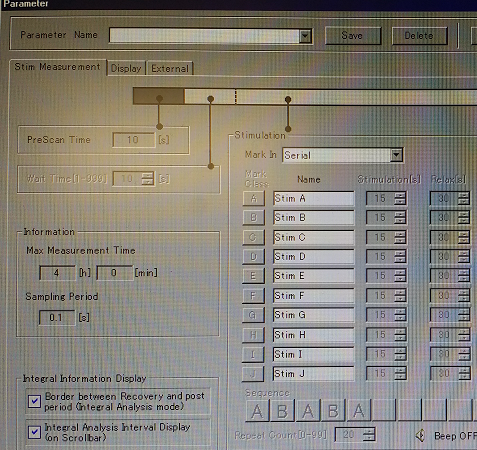
The last line of the script is sending the signal through the serial port. In this example, it is “A ” followed by Python’s string literal for a Carriage Return. That was one of the strings expected by ETG-4000, i.e. it was on the list previously set up in Parameter/Stim Measurement:

The easiest way for me to test whether I was sending correct signals was to use the Communication Test in the External tab (see the second screenshot). Once the test is started, you can run the Python script to test whether the serial signals are coming through.

If the triggers work as expected, the code sections for serial triggers can be embedded in the experiment. It can be done via GUI or code editor. That’s where to add code using GUI:

The next step is adding the triggers for the beginning, each stimulus/block, and the end of recording.

Here is an example of an experiment using serial port triggers to delimit blocks of stimuli and individual stimuli.

Due to the sampling rate, I had to add delay between the triggers delimiting the blocks, otherwise they would not be captured accurately. The triggers for block sections had to be send consecutively because the triggers cannot be interspersed (not sure if that’s because of my settings). For instance, AABBAA is fine, but ABABAB is not.