Removing triggers from Hitachi ETG-4000 fNIRS recordings

Homer2 needs a particular format of a .nirs file that cannot have consecutive triggers (also called Marks in Hitachi files).
hitachi2nirs Matlab script also removes the markers but I wanted to recreate the whole process and be sure that I’m doing it correctly. Answering Yes to the question Do you want to remove the marker at the end of each stimulus? y/n will run the following code:

To remove the triggers/markings in R follow the steps below.

Start with loading the packages and files

This will produce a table showing a structure

## 'data.frame': 2500 obs. of 50 variables:
## $ Probe1 : int 1 2 3 4 5 6 7 8 9 10 ...
## $ CH1.703.6. : num 0.1865 0.0182 -0.4738 -0.1521 -0.3078 ...
## $ CH1.829.0. : num 0.412 0.547 0.534 0.314 0.106 ...
## $ CH2.703.9. : num 0.739 0.764 0.746 0.751 0.762 ...
## $ CH2.829.3. : num 1.01 1.01 1.03 1.03 1.03 ...
## $ CH3.703.9. : num 1.57 1.58 1.59 1.59 1.6 ...
## $ CH3.829.3. : num 1.64 1.65 1.65 1.66 1.67 ...
## $ CH4.703.9. : num 1.48 1.45 1.55 1.51 1.47 ...
## $ CH4.828.8. : num 1.63 1.64 1.66 1.66 1.68 ...
## $ CH5.703.6. : num -1.226 -1.743 -0.546 -0.556 -0.75 ...
## $ CH5.829.0. : num 0.00397 -0.23102 -1.11099 -0.64056 -1.01425 ...
## $ CH6.703.1. : num -0.247 -0.335 -0.371 -0.667 -1.064 ...
## $ CH6.828.8. : num 0.987 0.892 0.892 0.933 0.796 ...
## $ CH7.703.9. : num 1.03 1.3 1.11 1.02 1.44 ...
## $ CH7.829.3. : num 1.2 1.22 1.21 1.23 1.23 ...
## $ CH8.702.9. : num 2 2.01 2.03 2.04 2.04 ...
## $ CH8.829.0. : num 1.79 1.81 1.81 1.83 1.85 ...
## $ CH9.703.9. : num 2.07 2.02 2.12 2.12 2.01 ...
## $ CH9.828.8. : num 1.82 1.82 1.82 1.84 1.85 ...
## $ CH10.703.1. : num -0.492 -0.135 -0.598 -0.598 -0.328 ...
## $ CH10.828.8. : num 0.672 0.61 0.823 0.724 0.724 ...
## $ CH11.703.1. : num -1.042 -0.255 -1.773 -1.419 -0.449 ...
## $ CH11.828.8. : num 1.071 1.052 0.804 1.107 1.047 ...
## $ CH12.702.9. : num 0.684 0.771 0.704 0.512 0.905 ...
## $ CH12.829.0. : num 1.02 1.01 1.03 1.08 1.07 ...
## $ CH13.702.9. : num 2.03 2.03 2.05 2.05 2.05 ...
## $ CH13.829.0. : num 1.76 1.78 1.79 1.79 1.81 ...
## $ CH14.703.6. : num -1.719 -1.196 -0.359 -0.883 -1.99 ...
## $ CH14.829.0. : num -0.0832 0.0209 -0.1123 -0.2014 -0.2011 ...
## $ CH15.703.1. : num 1.97 1.89 1.82 1.98 2.09 ...
## $ CH15.828.8. : num 1.81 1.78 1.8 1.81 1.84 ...
## $ CH16.703.4. : num 0.0209 -0.4283 -0.0848 -0.278 0.4996 ...
## $ CH16.829.0. : num 1.36 1.26 1.38 1.23 1.27 ...
## $ CH17.702.9. : num 2.35 2.35 2.36 2.37 2.38 ...
## $ CH17.829.0. : num 2.08 2.09 2.11 2.12 2.13 ...
## $ CH18.703.6. : num 2.1 2.1 2.09 2.1 2.1 ...
## $ CH18.828.5. : num 2.14 2.14 2.14 2.15 2.15 ...
## $ CH19.703.6. : num -1.104 -1.134 -0.658 -0.886 -0.336 ...
## $ CH19.829.0. : num -0.1239 0.09369 0.05463 0.01617 -0.00427 ...
## $ CH20.703.4. : num 1.65 1.55 1.28 1.35 1.56 ...
## $ CH20.829.0. : num 1.77 1.75 1.8 1.81 1.8 ...
## $ CH21.703.4. : num 1.41 1.43 1.31 1.42 1.46 ...
## $ CH21.829.0. : num 1.76 1.77 1.76 1.77 1.79 ...
## $ CH22.703.6. : num 2.11 2.29 2.18 2.24 2.21 ...
## $ CH22.828.5. : num 2.17 2.17 2.18 2.17 2.2 ...
## $ Mark : int 0 0 0 0 0 0 0 0 0 0 ...
## $ Time : num 0 0.1 0.2 0.3 0.4 0.5 0.6 0.7 0.8 0.9 ...
## $ BodyMovement: int 0 0 0 0 0 0 0 0 0 0 ...
## $ RemovalMark : int 0 0 0 0 0 0 0 0 0 0 ...
## $ PreScan : int 1 1 1 1 1 1 1 1 1 1 ...

table of triggers

## .
## 1 2 9 10
## 73 10 4 2

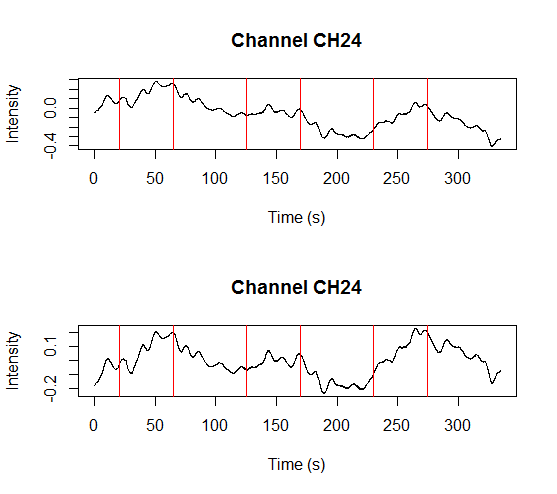
and a plot showing raw data in one channel (quite noisy) with all the triggers.
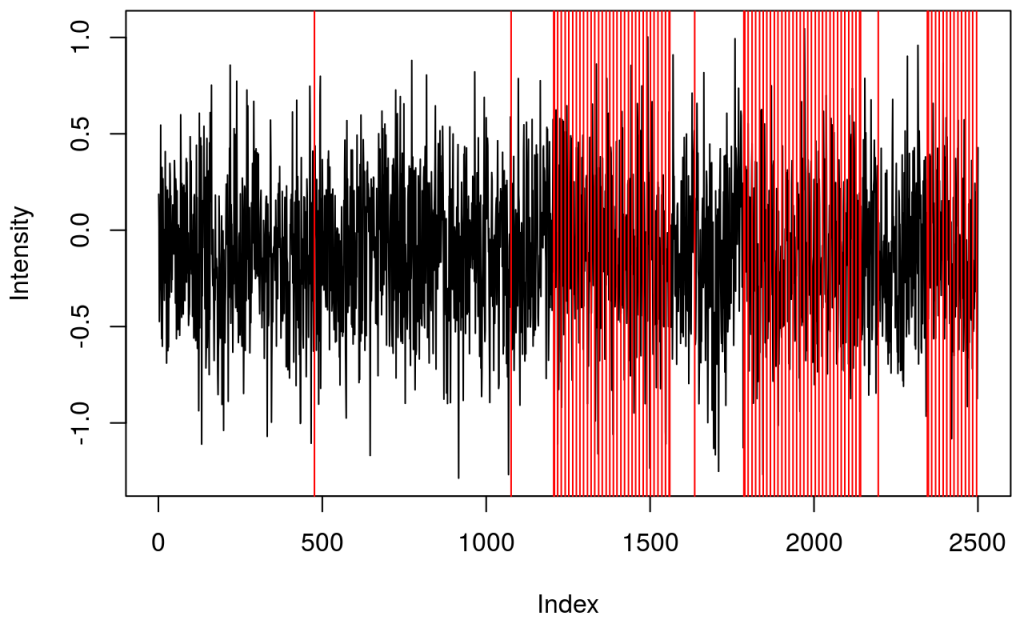
This shows several triggers (all plotted using red colour). I will only keep trigger ‘2’ to mark the beginning of a block. The first step is cleaning the data by removing all but trigger ‘2’.

Which results in fewer events

It turned out that there were two ‘2’ triggers next to each other. That’s because ETG-4000 does not allow odd triggers next to each other, e.g. 212 is invalid, but 22111122 is valid. I wrote a function (soon incorporated into fnirsr package) that deals with this problem.
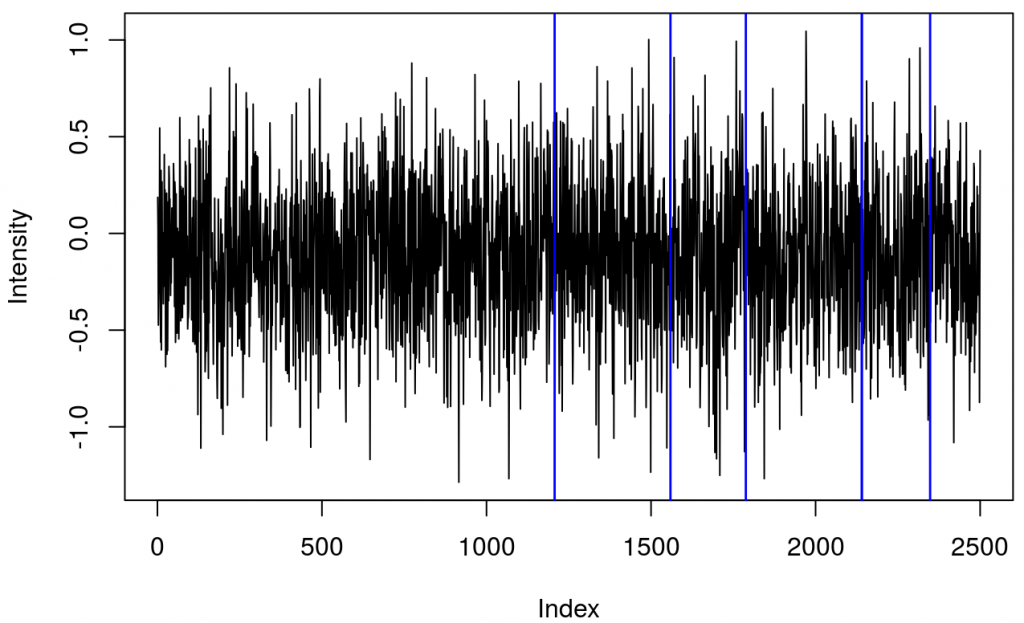
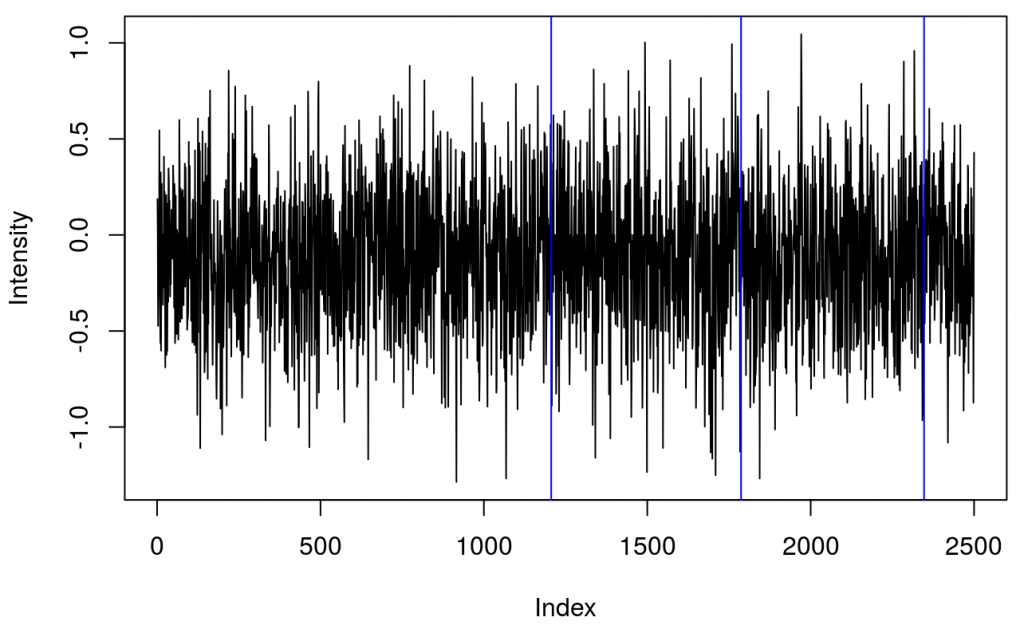
The result, only the first block events, is here

Interactive plot of fNIRS data

The easiest way to plot ETG-4000 data in R is by using plot_ETG4000() from fnirsr package. However, if you want to explore your data in more detail, then an interactive plot is more appropriate.

I used dygraphs package to create the chart below. In case of using many channels, the colours in the legend can get a bit mixed up like in my example. I haven’t figured out yet how to add a custom colour palette that could deal with multiple channels.

One way or another, this code snippet should be enough to start generating interactive charts. I haven’t added the interactive chart to the main plotting function (i.e. plot_ETG4000) but I might do it in future releases.

The code used to generate the chart is here:

PS: The dygraph generated correctly in the interactive window, when using R notebooks, and when knitting. When I Saved as Web Page from RStudio, I got a header error that I had to clean by removing a tag (<!DOCTYPE html>) from the generated html file.

fnirsr - Fixing bugs, Travis CI, and detrending

I haven’t worked on fnirsr (my R package for analysing fNIRS data) for a while so I thought it’s time for some improvements. I read a great introduction to Travis CI and decided to make it work this time. After running R CMD check (and devtools::check()) several times to fix multiple bugs, I finally got to see that lovely green badge 🙂

The package still needs more testing, but so far it does its job. On top of that, I finally added a function that removes a linear trend from an fNIRS signal:

For more details and the latest updates see the project’s GitHub page.
CRAN, here I come!

Sending serial triggers from PsychoPy to ETG-4000 fNIRS

In the process of designing my latest experiment in PsychoPy I realised that setting up the serial port connection is not the most obvious thing to do. I wrote this tutorial so that others (and future me) won’t have to waste time reinventing the wheel.

After creating an initial version of my experiment (looping over a wav file) I tried to figure out how to send a relevant trigger to my fNIRS. Luckily, the PsychoPy tutorial has a section about using a serial port, but after reading this I still wasn’t sure how to use the code with my script. After a quick brainstorm with the lab technician, we figured out that a simple script (see below) is indeed sending triggers to the fNIRS:

To better understand the arguments of the serial.Serial class please consult the pySerial documentation.
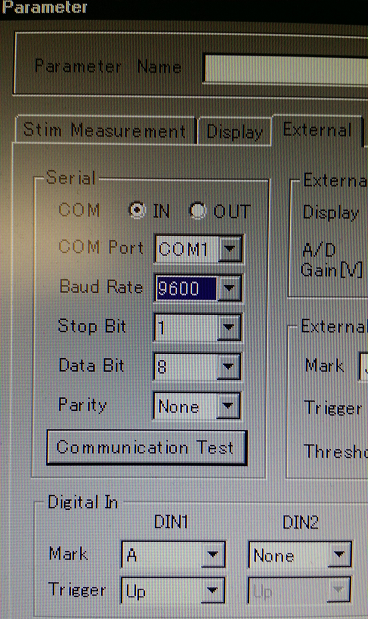
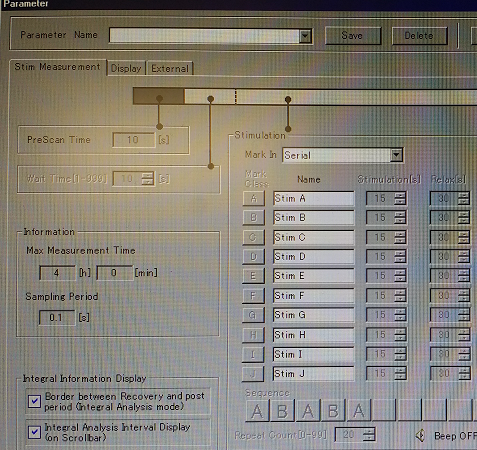
The argument (‘COM1’) is the name of the serial port used. The second argument is the Baud rate, it should be the same as the Baud rate used in the Parameter/External settings of the ETG-4000:

The last line of the script is sending the signal through the serial port. In this example, it is “A ” followed by Python’s string literal for a Carriage Return. That was one of the strings expected by ETG-4000, i.e. it was on the list previously set up in Parameter/Stim Measurement:

The easiest way for me to test whether I was sending correct signals was to use the Communication Test in the External tab (see the second screenshot). Once the test is started, you can run the Python script to test whether the serial signals are coming through.

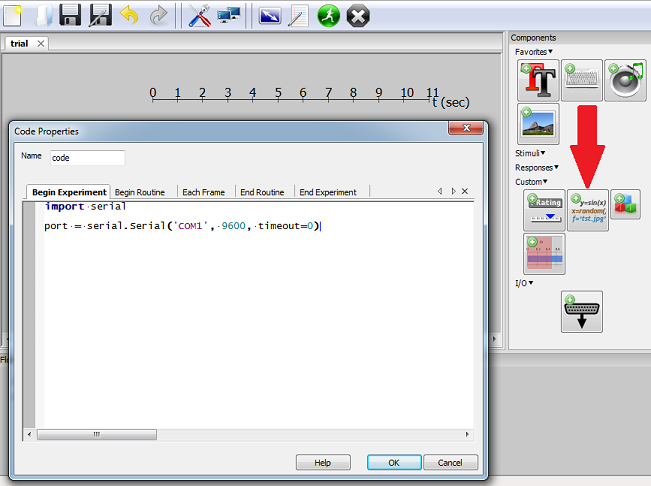
If the triggers work as expected, the code sections for serial triggers can be embedded in the experiment. It can be done via GUI or code editor. That’s where to add code using GUI:

The next step is adding the triggers for the beginning, each stimulus/block, and the end of recording.

Here is an example of an experiment using serial port triggers to delimit blocks of stimuli and individual stimuli.

Due to the sampling rate, I had to add delay between the triggers delimiting the blocks, otherwise they would not be captured accurately. The triggers for block sections had to be send consecutively because the triggers cannot be interspersed (not sure if that’s because of my settings). For instance, AABBAA is fine, but ABABAB is not.

fnirsr - An R package to analyse ETG-4000 fNIRS data

As I mentioned in my previous post, I am trying to get my head around analysing fNIRS data collected using Hitachi ETG-4000. The output of a recording session with ETG-4000 can be saved as a raw csv file (see the example). This file seems to be pretty straightforward to parse: the top section is a header, and raw data starts at line 41.

I created a set of basic R functions that can deal with the initial stages of the analysis and I wrapped them in an R-package. It is still a very early alpha (or rather pre-alpha), as the documentation is still sparse and no unit tests were made. I only have several raw csv files and they seemed to work fine with my functions but I’m not sure how robust they are.
Anyway, I think it will be useful to release it even in the early stage and work on the functions as time goes by.

The package can be found on GitHub and it can be installed with the following command:

devtools::install_github("erzk/fnirsr")

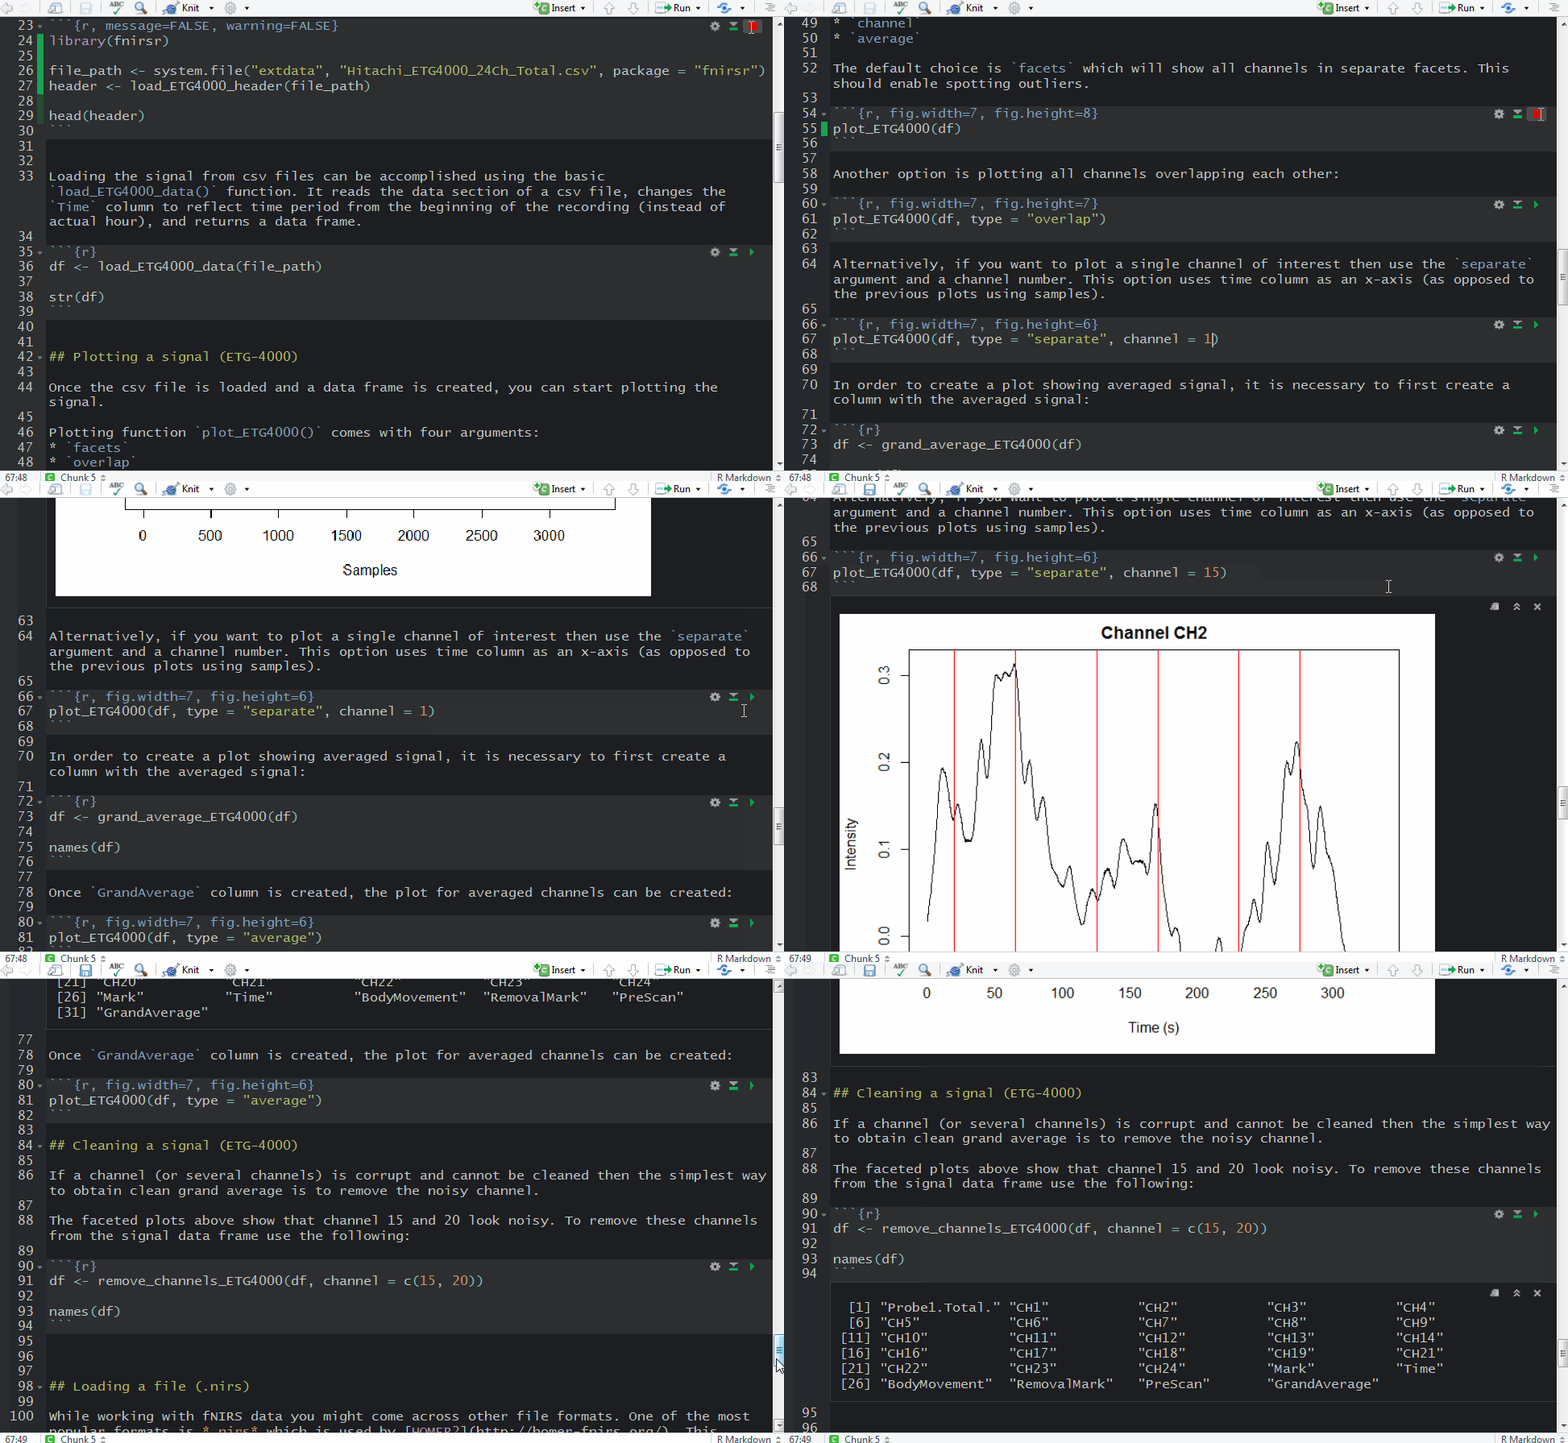
A vignette (Rmd) is here.

HTML vignette:

I couldn’t find any other R packages that would deal with these files so feel free to contact me if you work(ed) on something similar. Pull requests are encouraged.

Loading and plotting nirs data in R

Recently I started to learn how to use Hitachi ETG-4000 functional near-infrared spectroscopy (fNIRS) for my research. Very quickly I found out that, as usual in neuroscience, the main data analysis packages are written in MATLAB.

I couldn’t find any script to analyse fNIRS data in R so I decided to write it myself. Apparently there are some Python options, like MNE or NinPy so I will look into them in future.

ETG-4000 records data in a straightforward(ish) .csv files but the most popular MATLAB package for fNIRS data analysis (HOMER2) expects .nirs files.

There is a ready-made MATLAB script that transforms Hitachi data into the nirs format but it’s only available in MATLAB. I will skip the transformation step for now, and will work only with a .nirs file.

The file I used (Simple_Probe.nirs) comes from the HOMER2 package. It is freely available in the package, but I uploaded it here to make the analysis easier to reproduce.

My code is here:

This will produce separate time series plots for each channel with overlapping triggers, e.g.:

The entire analysis workflow:

Other files:
- RMarkdown file
- html report

I hope this helps.
More to follow.