Extracting pitch track from audio files into a data frame

My task was to extract pitch values from a long list of audio files. Previously I used Praat and R for this task but looping in R was rather slow so I wanted to find another solution. The following analysis was developed on Linux (Ubuntu).

Firstly, aubio (CLI-only Python tool) was used to extract pitch from wav files. aubio has fewer arguments than Praat and it returned awkward values using default settings so I didn’t explore it further. The good thing about it is that it is easy to use and is relatively simple and Python-native. To extract pitch with aubio use:

sudo apt install aubio-tools
aubiopitch -i P17_trim_short_10.000-11.150.wav

Eventually I decided to stick to Praat, which is the workhorse of phonetics and can be used from the command line.

Praat saves all commands that are executed and this can be a great start for creating a script. More information about scripting in Praat is here. My solution is here:

This script will extract .pitch files from all .wav files in the working directory and will save them to a subfolder. Praat scripts can be called from the command line:

praat --run extract_pitch_script.praat

Which will extract pitch tracks from all .wav files in the directory. The pitch extraction will use default settings in Praat. The output will be one .pitch file for each .wav file. The files themselves contain all candidates and are not in a tidy format so they have to be transformed. This step could probably be done in Praat scripting but I did not have patience to achieve it there and I moved to R which could easily produce desired output.

R can be called from the command line using littler. Shebang on the first line means that the script can be called from the command line. The script below transforms .praat files into clean .csv files.

To invoke the R script, run in the command line:

r praat_pitch_analysis_CLI.R untitled_script.pitch

This creates a .csv file with the best candidate pitch above a certain confidence threshold. Pitch extraction algorithm used by Praat was developed by Boersma (1993).

Automatic splitting of audio files on silence in Python

In my previous post I described how to split audio files into chunks using R. This time I wanted to use Python to prepare long audio files (.mp3) for further analysis. The use case would be splitting a long audio file that contains many words/utterances/syllables that need to be then analysed separately, e.g. recorded list of words.

The analysis described here was conducted on Linux (Ubuntu 16.04) and it should be fairly similar on MacOS, but Windows would require quite a few ammendments.

The first step was to turn the original .m4a files into .mp3 and to extract the segment I was interested in. I used ffmpeg for these tasks. This can be skipped if your files are already clean.

ffmpeg -i P17.m4a P17.mp3
ffmpeg -i P17.mp3 -ss 00:17:50 -to 00:23:30 -c copy P17_trim.mp3

The second command created a copy of the original .mp3 file and extracted the segment between 17 min 50 sec and 23 min 30 sec. That’s where speech was recorded in my file.

ffmpeg output

The continuous audio file that I used contained repeated utterances of the same syllable. Use the code below to split this file into segments. Silence detection is conducted using Support-vector machine (SVM):

Install pyAudioAnalysis and run on the command line:

python pyAudioAnalysis/pyAudioAnalysis/audioAnalysis.py silenceRemoval -i P17_trim_short.mp3 --smoothing 1.0 --weight 0.3
pyAudioAnalysis detect silence in audio files
Top row shows the waveform of the audio signal. Y-axis is amplitude, X-axis is time. Bottom row shows the probabily of non-silence, the vertical lines are markers that will be used to split the file.

The result is a list of sliced wav files. The names contain timings of the boundaries.

pyAudioAnalysis silenceRemoval output example.

All files in a given directory can be split using the following script:

Make sure to point the script to the directory where audioAnalysis.py lives. Modifying smoothing and weight parameters will lead to different effects so this should be adjusted depending on a type of audio recording. By default the script will show a pop-up window with the suggested split. This is very useful for monitoring data quality. The Python script can be used from the command line with:

python split_continuous_audio.py

Book Review - Sound Analysis and Synthesis with R

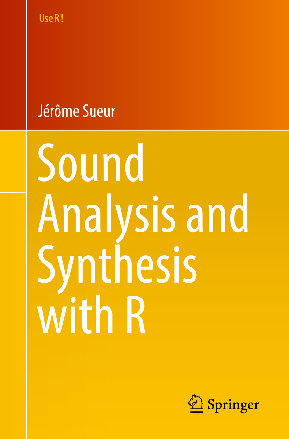
R might not be the most obvious tool when it comes to analysing audio data. However, an increasing number of packages allows analysing and synthesising sounds. One of such packages is seewave. Jerome Sueur, one of the authors of seewave, now wrote a book about working with audio data in R. The book is entitled Sound Analysis and Synthesis with R and was published by Springer in 2018. I highly recommend it to anyone working with audio data.

The book starts with a general explanation of sound. Then it introduces R to readers who have no experience using it. Over the 17 chapters the author describes basic audio analyses that can be conducted with R. The underlying concepts are explained using both mathematical equations and R code. There is also some material on sound synthesis, but this is a minor point when compared to the space devoted to the analysis. Additional materials include sound samples used across the book.

As mentioned before the main topic of the book is the analysis of sound, predominantly in scientific settings. Researchers (or data scientists) typically would want to load, visualise, play, and quantify a particular sound that they work on. These basic steps are desribed in this book with code examples that are simple to follow and richly illustrated with R-generated plots. Check the book preview here.

If you ever need to paste, delete, repeat or reverse audio files with R then recipes for these tasks can be found in this book. The book contains twenty DIY Boxes which show alternative ways to use already coded functions and demonstrate new tasks. These boxes cover topics ranging from loading audio files, plotting to frequency and amplitude analysis.

Even though the author created his own package, the book shows how to use a wide range of audio-specific R package like tuneR or warbleR.

I can only wish that this book had been released earlier. It would have saved me a lot of pain conducting audio analyses.

Final verdict: 5/5

Spectrograms in R - a gallery

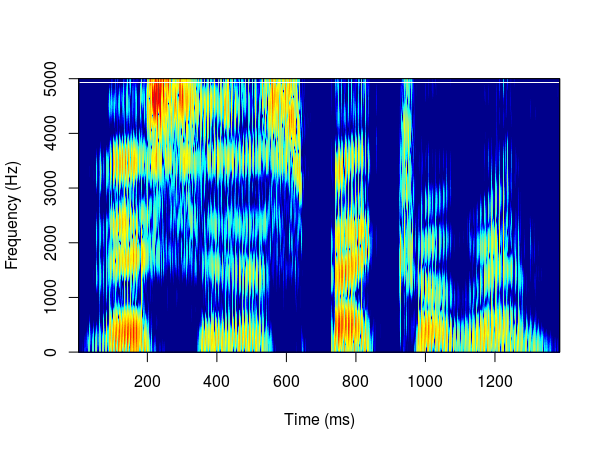
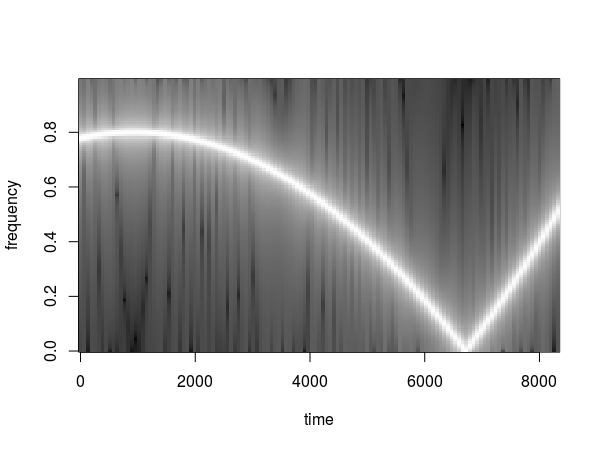
Creating a spectrogram is a basic step in every analysis of audio signals. Spectrograms visualise how frequencies change over a time period. Luckily, there is a selection of R packages that can help with this task. I will present a selection of packages that I like to use. This post is not an introduction to spectrograms. If you want to learn more about them then try other resources (e.g. lecture notes from UCL).

The examples shown below came mostly from the official documentation and were kept as simple as possible. The majority of functions allow further customisation of the plots.

phonTools

seewave

seewave and ggplot2

signal

soundgen

warbleR

hht

Creating a spectrogram from the scratch is not so difficult, as shown by Hansen Johnson in this blog post. Another solution was provided by Aaron Albin.

Praat is a workhorse of audio analysis. It is a standalone software, but there is also an R controller called PraatR, that allows calling Praat functions from R. It is not the easiest tool to use so I will just mention it here for reference.

I am pretty sure that there are more packages that allow creating spectrograms but I had to stop somewhere. Feel free to leave comments about other examples.